Short-spacings measurements
ALMA is composed of:
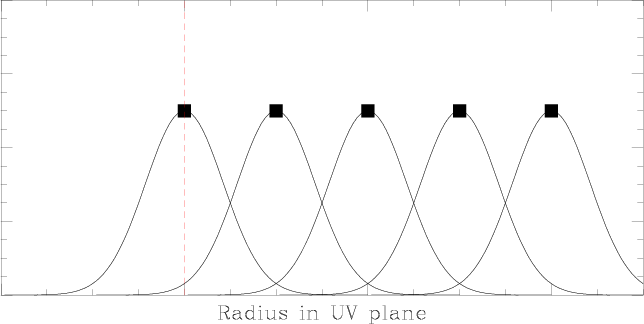
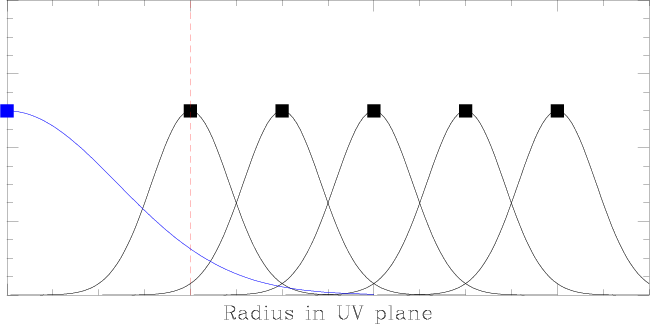
This figure illustrates the tranfert function of an interferometer, in a 1-D uv plane. The Y axis is arbitrary. The black square are the position of the measured points in the uv plane. An interferometer cannot sample all spatial frequencies: the shortest baseline distance defines the shortest spatial frequency that is measured (vertical red line). Each measurement is actually a local average of the visibilities, weighted by the transfert function of each individual antenna (here approximated by Gaussian).
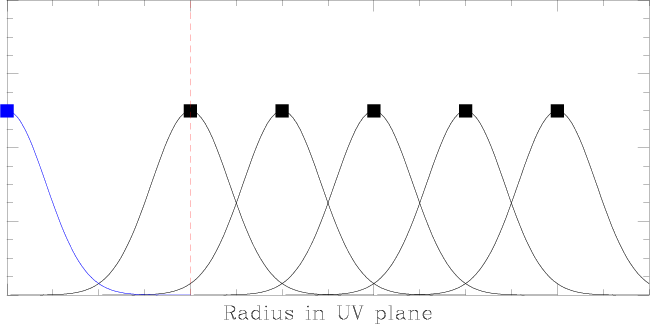
Adding the measurement of a single-dish antenna of the same diameter as that of the array antennas (blue curve) provides the zero-spacing point. This is usually not enough to fill the central gap in the uv measurements.
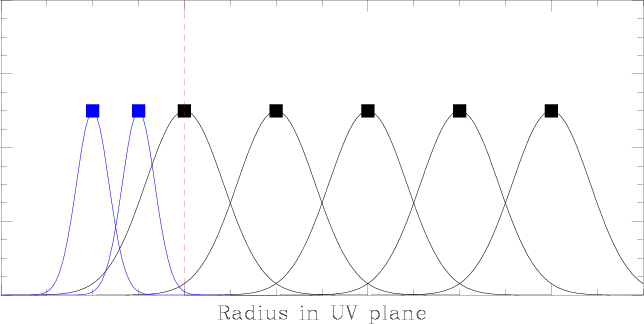
An array composed of smaller antennas (blue curves) can sample shorter baselines. But this does not provide the zero-spacing measurement. This is the CARMA array.
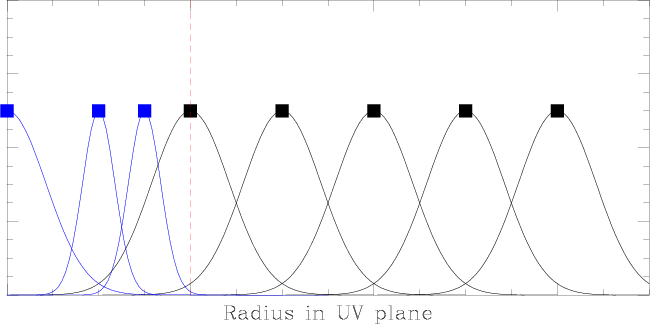
A good solution to fully sample the uv plane is to combine the two previous setups: the short-spacings are measured by an array of smaller antennas, while the zero-spacing is measures by a single-dish antenna of the same diameter as the antennas of the main array. This is ALMA+ACA+the single-dish antennas.
Another solution to fully sample the uv plane is to combine the interferometric data with the measurements obtained with a single-dish antenna whose diameter is larger than that of the array antennas: the single-dish provides in that case both the zero- and the short-spacings. This is the IRAM PdBI + 30m.
- the main array (ALMA-B, 50 12-m antennas)
- the ALMA Compact Array (ACA, 12 7-m antennas), to measure the short-spacings
- 4 12-m antenna operating in single-dish mode, to measure the zero-spacings

This figure illustrates the tranfert function of an interferometer, in a 1-D uv plane. The Y axis is arbitrary. The black square are the position of the measured points in the uv plane. An interferometer cannot sample all spatial frequencies: the shortest baseline distance defines the shortest spatial frequency that is measured (vertical red line). Each measurement is actually a local average of the visibilities, weighted by the transfert function of each individual antenna (here approximated by Gaussian).

Adding the measurement of a single-dish antenna of the same diameter as that of the array antennas (blue curve) provides the zero-spacing point. This is usually not enough to fill the central gap in the uv measurements.

An array composed of smaller antennas (blue curves) can sample shorter baselines. But this does not provide the zero-spacing measurement. This is the CARMA array.

A good solution to fully sample the uv plane is to combine the two previous setups: the short-spacings are measured by an array of smaller antennas, while the zero-spacing is measures by a single-dish antenna of the same diameter as the antennas of the main array. This is ALMA+ACA+the single-dish antennas.

Another solution to fully sample the uv plane is to combine the interferometric data with the measurements obtained with a single-dish antenna whose diameter is larger than that of the array antennas: the single-dish provides in that case both the zero- and the short-spacings. This is the IRAM PdBI + 30m.