SAmpler
Threshold Adjustment
Olivier GENTAZ IRAM/Back-End
Aug. 2006
In order a digital correlator works with a
minimum loss in efficiency, the sampling thresholds of its digitizer have to be
adjusted to their optimal level. Two indicators used in the Digitizer Test
Equipment developed by IRAM have been defined: the offset and the amplitude
relative errors.
This memo gives the mathematical definition of
these two parameters. The equations hereunder are those implemented in the
following test softwares:
-
SHERIF_V1a1
(IRAM-PdBNG version DTE)
-
ALCOR_V1a0
(ALMA version DTE)
-
PDF_Viewer_V2a0
software.
1. The PDF Measurement
Assuming a relative quantization step a=q/s , the gaussian distribution of the input samples
(Probability Density Function) is divided into N equally spaced bins having
each a theoretical probability of
occurrence PTH(i) with iÎ[0;N-1].
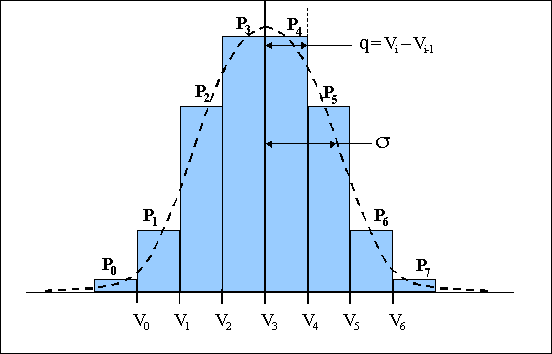
Figure 1: The Ideal Sample
Statistical Distribution (ALMA case: N=8).
Ideally, the N probabilities PMES(i)
measured thanks to the DTE should be compared to the N theoretical
probabilities one by one in order to properly adjust the DG thresholds.
In practice, for N > 4, the DG levels cannot be adjusted
individually and even so, it would be quiet cumbersome to deal with N
adjustments. So, it has been chosen to only adjust the offset and the amplitude
of the threshold grid. Thus the adjustment procedure will be much more
convenient and moreover, as a gaussian distribution is entirely defined with
only its two first statistical moments (mean and standard deviation), this
method will provide a “best fit” adjustment of the comparator
thresholds.
For both the offset and the amplitude, the
relative difference between the expected value and the measured value is
displayed along with time. The relative difference between the expected and the
measured means is called the relative offset error em whereas the relative difference
between the expected and the measured standard deviations is called the
relative amplitude error es. Once these displayed errors are lower than a value to be defined, it
is assumed that the DG thresholds are properly adjusted.
2. Equations
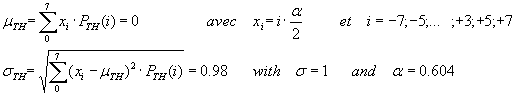
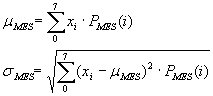
The displayed parameters are:
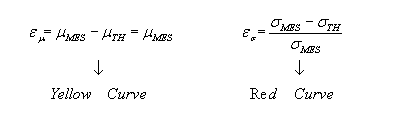
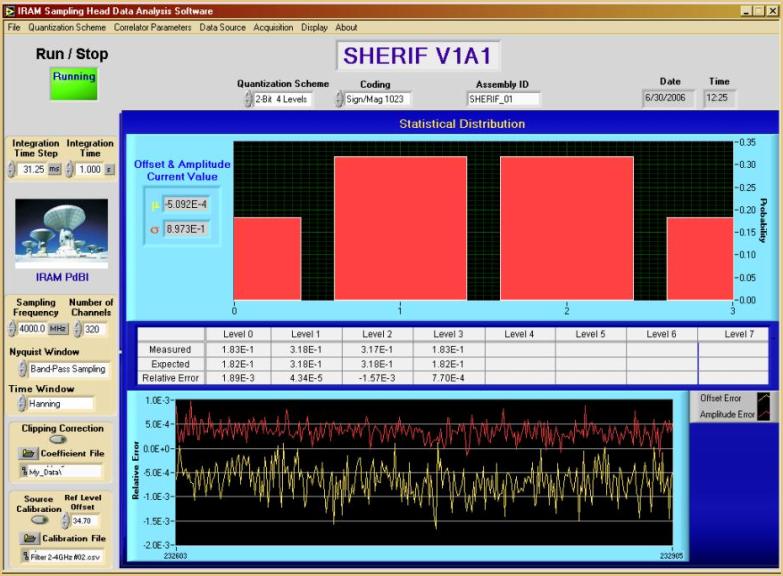
Figure 2: PDF Measurement Screenshot
of the DTE test software (IRAM case: N=4).
3. measuring random signals: a
tricky bussiness…