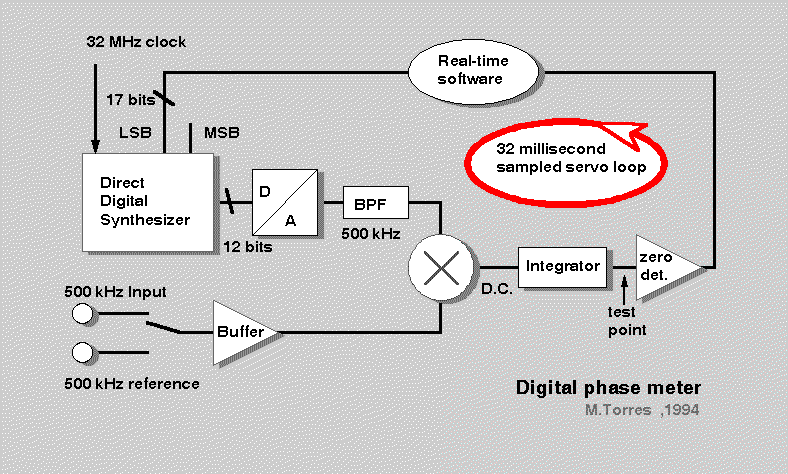
Fig.1 Block diagram of the phase meter
This paper is a very short description of a phasemetry technique that
has been developed by the Backend group of IRAM in the mid-90's for
monitoring the coaxial cable expansion on the Plateau de Bure Interferometer.
A 1.8GHz wave is round-tripped across the 400m cable (6000 wavelengths)
and downconverted to 500 kHz, so any variation in path length is
converted into phase variation of a 500 kHz sinewave.
The phasemeter described below is capable of measuring the phase to
an accuracy of 17 bits per turn, (2.5 millidegrees), or better with averaging.
1. Principle
The instrument makes use of the capability of DDS chips to generate sinewaves of steerable phase. The resolution depends on the number of bits within the chip accumulator and the D-to-A converter. The generated sinewave is mixed with the incoming wave which has the same frequency so a DC voltage is produced, which is equal to zero at quadrature. A voltage comparator commands the DDS (via application-specific software) to go back and forth to maintain quadrature. The last value written in the DDS when quadrature is reached is a digital image of the phase to be measured. This is basically a phase-locked loop featuring a "NCO" (number-controlled oscillator). To be absolute (not only incremental), the input can be switched to a reference signal. The phase to be measured is the difference between the two readouts.
Fig.1 Block diagram of the phase meter
2. Implementation
Four simultaneous phase meters have been laid out on a VME double Europe
PC board. The DDS clock frequency is 32 MHz and the operating frequency
is 500 kHz. Qualcomm 32-bit DDS and Analog Devices 12-bit D-to-As are used.
Crosstalk between channels is a major issue in this design. The analog
signals come in via 600 Ohm differential shielded cables. Individual metal
boxes contain the mixers, zero detectors, and the frontend switches.
A VME standard bus interface allows control via an external, commercial
computer board under OS-9.
Four coaxial test points allow to monitor the DDS, or to use the board
as a quad synthesizer, with 7mHz resolution.

Fig.2 : View of the board (click to enlarge)
3. Stability concerns
The servo loop is essentially non-linear, since 1-bit representation is used for the feedback. Thus it is inherently oscillating a few steps around the quadrature position. The amplitude of the oscillation is kept small and only the least significant bits are affected. The loop transfer function is sampled every 32 ms, and a software digital filter insures its stability. On a steady signal the software averages 32 results so the oscillation is averaged to less than one LSB.
4 . Dynamic tests
4.1 Slow tracking : for test purpose a 15milliHertz offset frequency
(or 24 degrees/sec) was applied to the input. The analog voltage at the
test point is an image of the transient loop error versus time, as shown
in Fig.3 . The slope is the one of the input signal, moving between two
refreshing periods.
![]()
Fig. 3 : Tracking a of a 15 mHz component (or 24 degrees per second)
4.2 stability: a 5 degree step was applied. One can see
on fig.4 the algorithm doubling the step every period until it crosses
the zero line, and iterating back slowly to reach convergence.
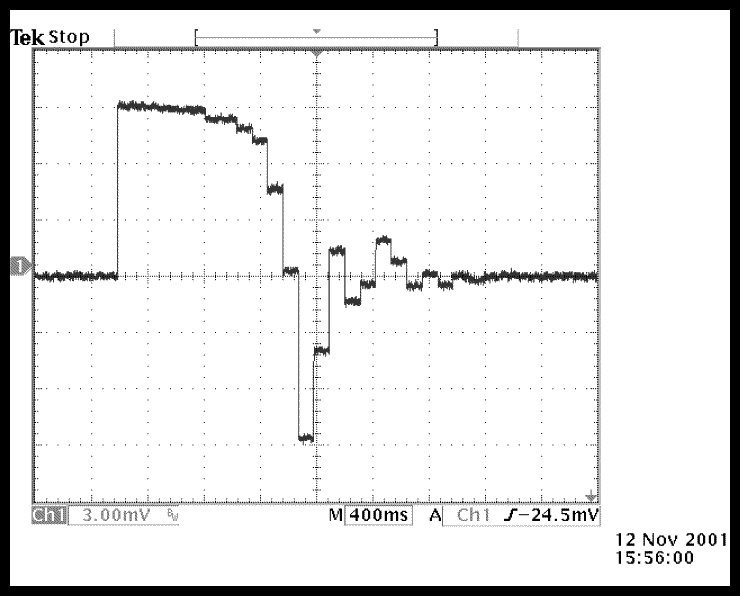
Fig. 4 : Recovery of a five degree transient
The table below (blue color) describes with more accuracy the recovery
sequence of fig.4.
Column 1 : value of the feedback
comparator
Column 2 : Digital command to
DDS
Column 3 : Phase offset, in
5 millidegree steps
Column 4 : Phase offset in degrees
4.3 Initialization : the first time a signal is applied, the existing phase difference progressively converges to zero. On fig.5, a largely offsetted signal was applied at t=300ms.1 03FF8000 -1 -24.359
0 04008000 1 -24.357
1 03FF8000 -1 -24.359
0 04008000 1 -24.357
0 04008000 1 -24.354
0 04010000 2 -24.348
0 04020000 4 -24.337
0 04040000 8 -24.315
0 04080000 16 -24.272
0 04100000 32 -24.184
0 04200000 64 -24.008
0 04400000 128 -23.656
0 04800000 256 -22.953
0 05000000 512 -21.547
0 06000000 1024 -18.734
0 08000000 2048 -13.109
1 01CD0000 -1126 -16.202
1 01CD0000 -1126 -19.295
0 05358000 619 -17.595
1 03560000 -340 -18.528
1 03560000 -340 -19.462
0 045D8000 187 -18.949
0 045D8000 187 -18.435
1 03CD0000 102 -18.715
0 041C0000 56 -18.561
1 03F10000 -30 -18.644
0 04080000 16 -18.600
1 03FC0000 -8 -18.622
1 03FC0000 -8 -18.644
0 04020000 4 -18.633
0 04020000 4 -18.622
1 03FF0000 -2 -18.627
0 04008000 1 -18.625
0 04008000 1 -18.622
1 03FF8000 -1 -18.625
0 04008000 1 -18.622
1 03FF8000 -1 -18.625
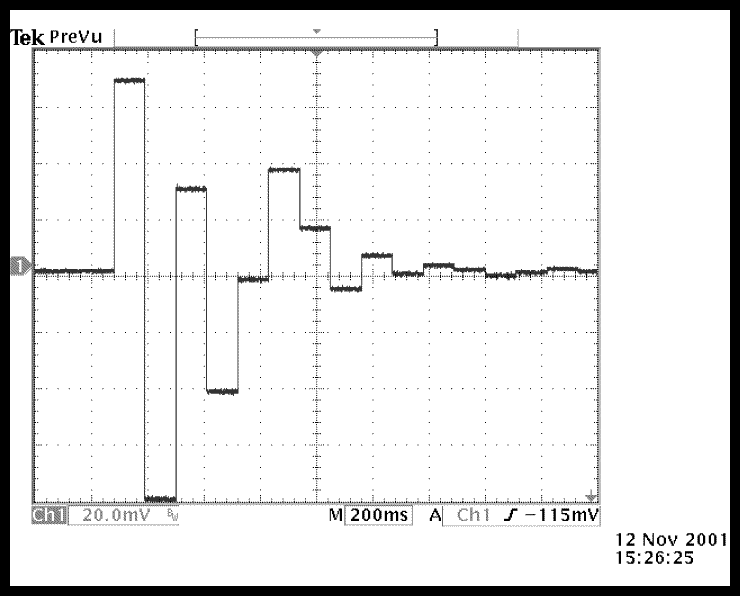
Fig.5 : Lock-in characteristic
4.5 Tracking range : When the input phase varies too fast, the algorithm losses lock. Figure 6 shows the phase difference at the test point just before loss of lock, for a frequency offset of 250 mHz. The loop is closed at t= 4.2 sec so the left part of the image illustrates a full turn under open loop condition.
![]()
Fig. 6 : Loop behavior at the limit of capture range
5. On-site behaviour
Twelve such phase meters have been built and connected to the Plateau
de Bure interferometer since 1996 and provide useful data for correcting
the phase drift of the coaxial cables linking the antennas to the building,
which otherwise would appear multiplied 120 times on the first LO at 230
GHz.
Figure 7 is a record during a quite stable period of operation, chosen
to show the limits of the system. The 4 segments correspond to small antenna
position changes, which cause mechanical bending of the cable. Full scale
is 0.12 degrees, which correspond to a 23 micrometers path change, on a
total length reaching 400 metres.
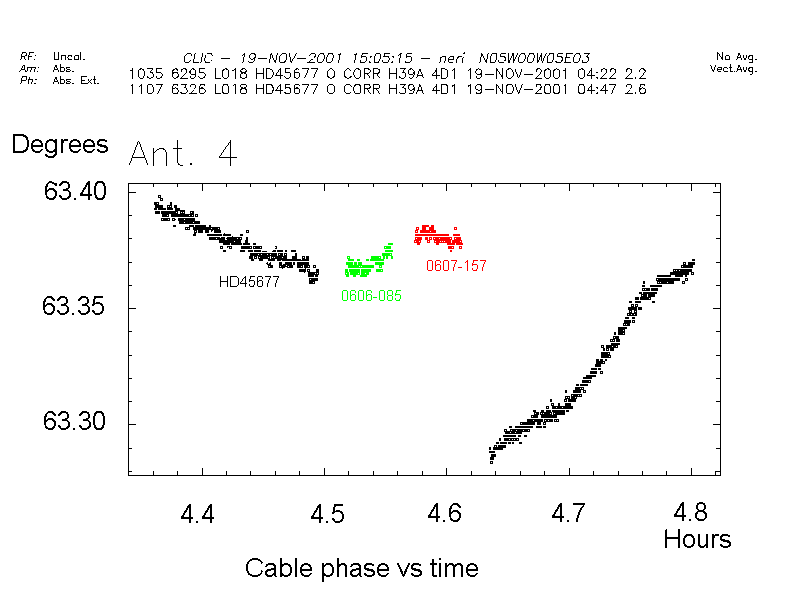
Figure 7 : On-site measurement
Below the noise the quantification of the readout does appear, at a sub-millidegree level. The peak-to-peak noise level is of the order of magnitude of 2 millidegrees. The short term contributions of the actual cable instability and the measurement system noise are approximately equal. Further filtering in the computer may reduce this noise but would be detrimental to transient response. In normal operation, large antenna motion stresses the cables in the wraps, causing drifts of several degrees.
6. Useful features of this method
1. Compared with the classic method of zero-crossing time chronometry, this one has no singular points. This is due to the circular structure of the DDS accumulator. This results in a seamless operation over one full turn.
2. When two sinewaves of the same frequency are present on the same board, their phase is corrupted by mutual crosstalk. For example a 2 millidegree error is caused by a -94dB isolation, which is already very hard to achieve on a single PCB. With this structure, the sinewaves present on the board are permanently servoed to the same position, making the crosstalk vector constant. This helps removing the common "S-shape" encountered in the response of many phasemeters.
3. The locally generated sinewave is cleaned up of its harmonic content in a bandpass filter. So if the input signal contains harmonics, they do not participate to the measurement, because they are multiplied by a zero counterpart. This makes the measurement insensitive to harmonic content changes. The measured phase is the one of the fundamental only.
7. Acknowledgement
I apologize for this paper to be 7 years late. Thanks to J.Y. Mayvial for the electronics engineering and to P. Chavatte for the software and testing.