Test
report on
the
two
first
DGCK (digitizer clock) assemblies
Marc Torres, 30-jan-2004
Two assemblies have
been built, according to the concept previously developed (1). This report
summarizes the measurements made on them.
Contents :
1/
Static
performance of the 4 GHz outputs
2/ Static
performance of the 250 MHz outputs
3/ Dynamic characteristics
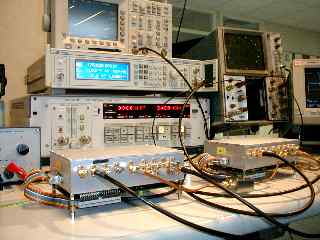
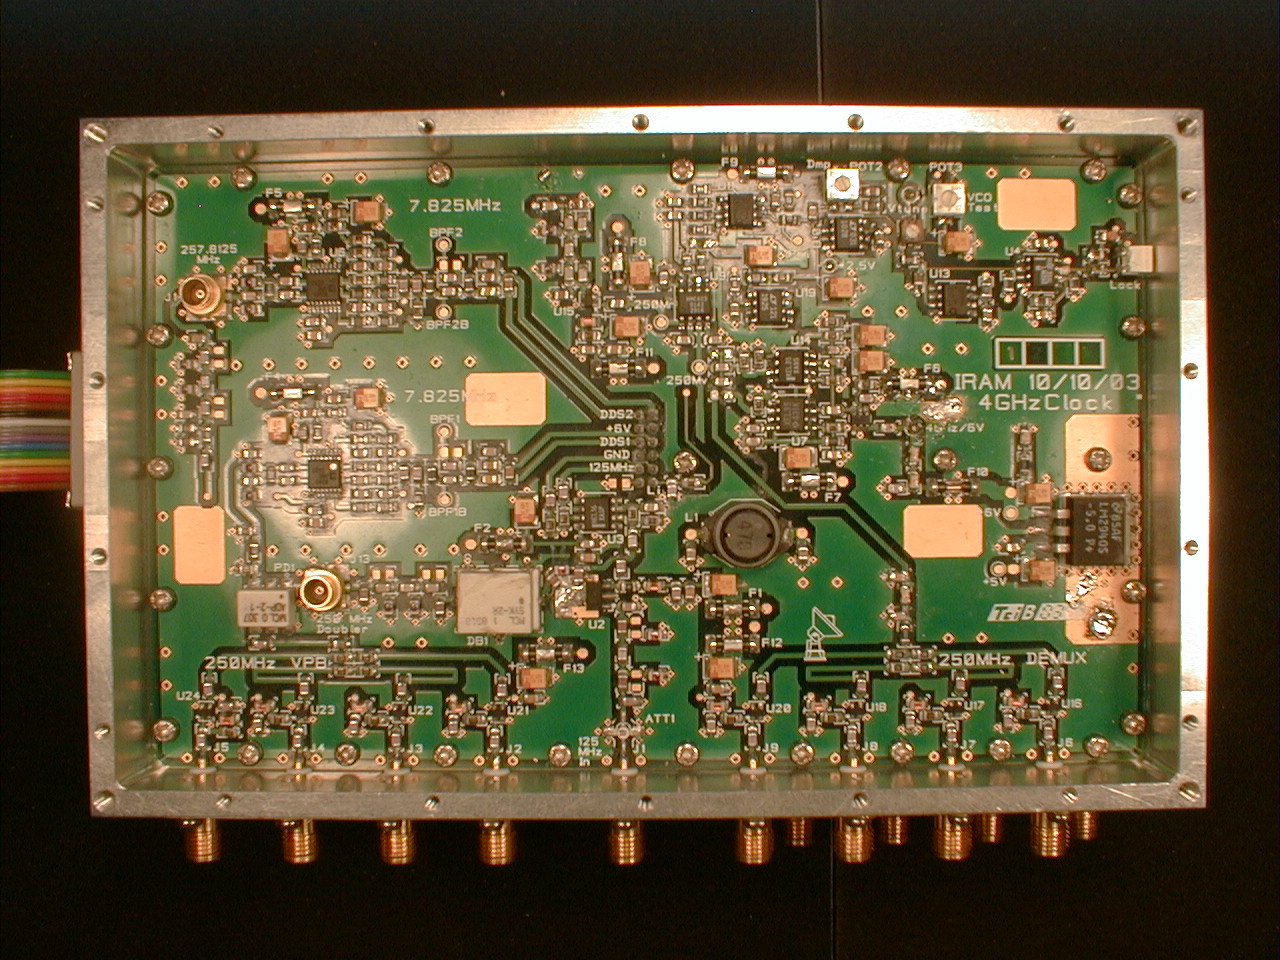
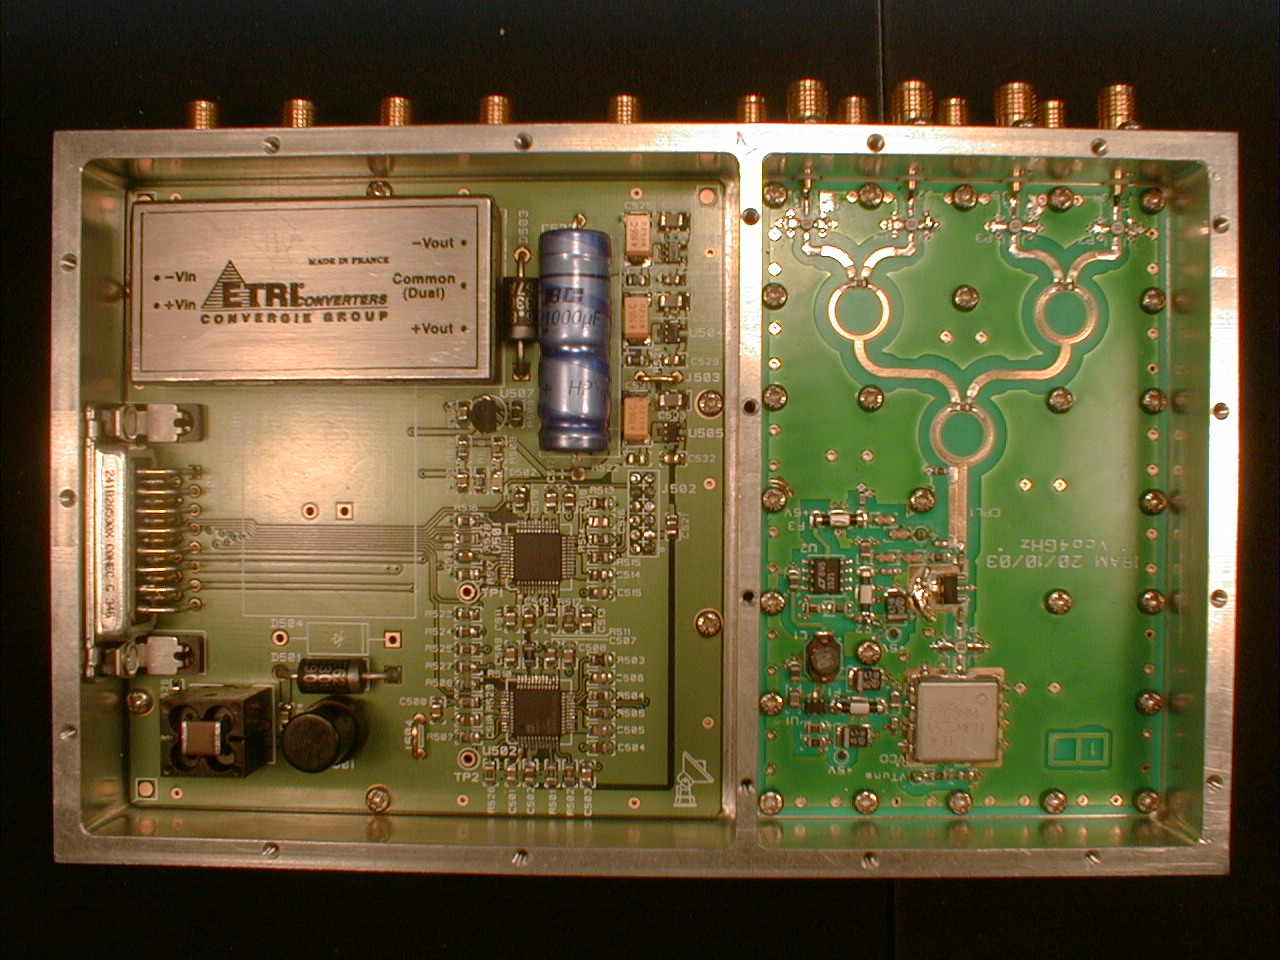
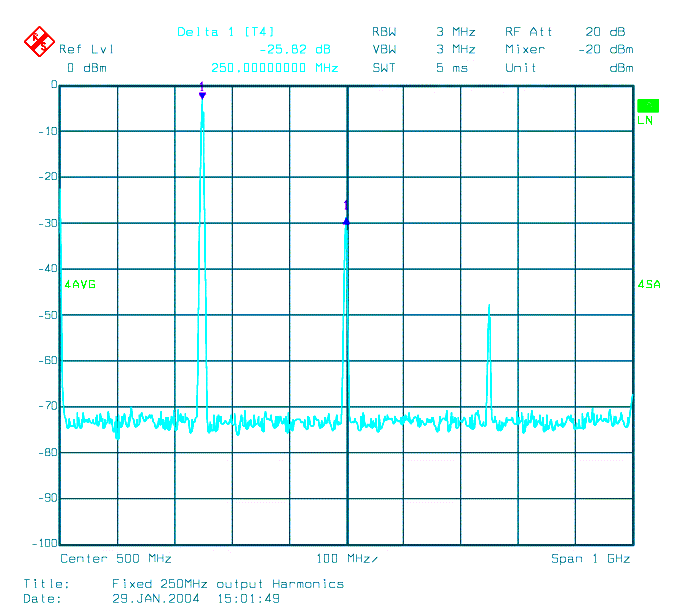
4/ Pictures of the DGCK ( 1 , 2 )
1/ Static
performance of the 4 GHz outputs
The 1.0 GHz and 3.0 GHz lines are created by the RF impedance
of the prescaler that periodically changes and pulls the
VCO .
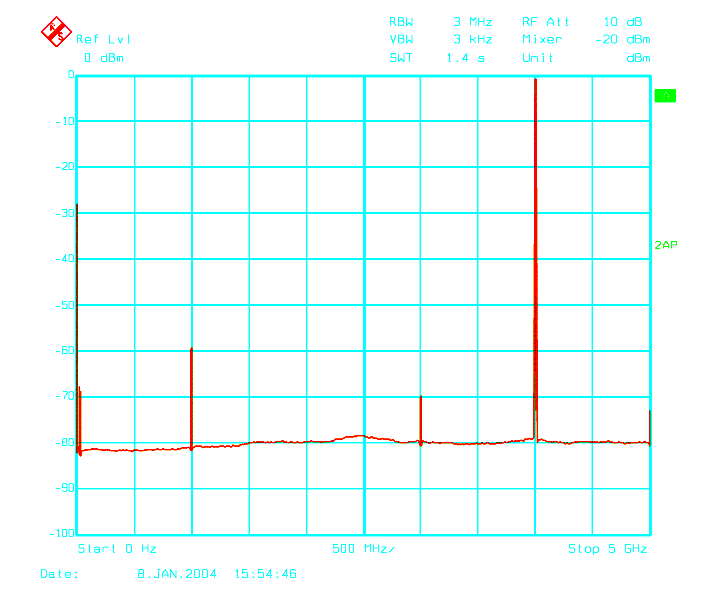
1.2 Return loss of the 4 GHz outputs:
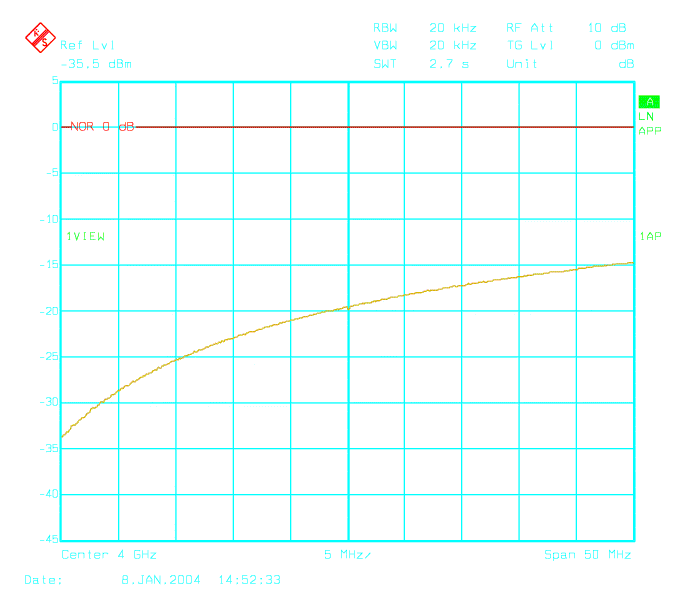
Measured with tracking generator on operating output
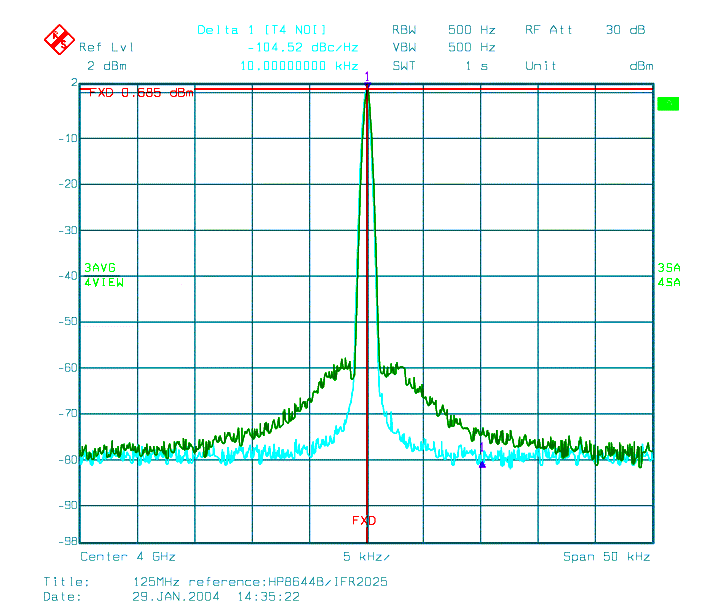
The phase noise that can be seen here mainly comes from the 125 MHz
generator that is used, which is raised by a theoretical factor of 24
dB.
Green trace : ordinary generator. Blue trace : good generator.
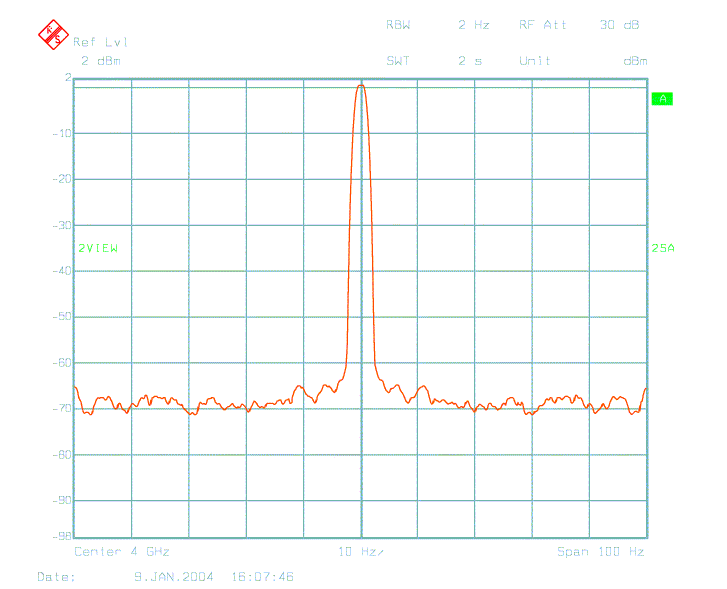
Same signal as above, at 2 Hz resolution .
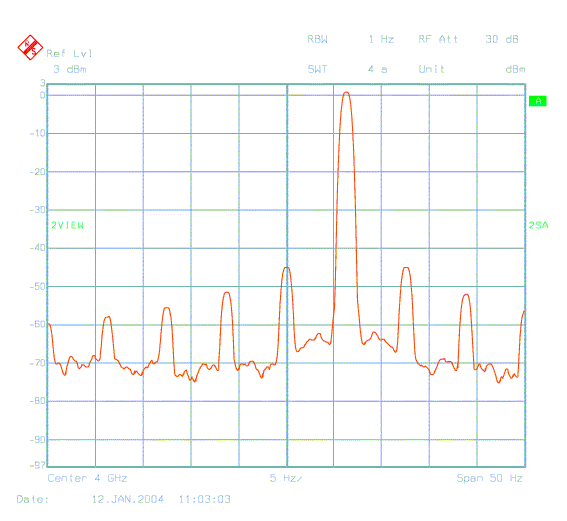
Phase noise.
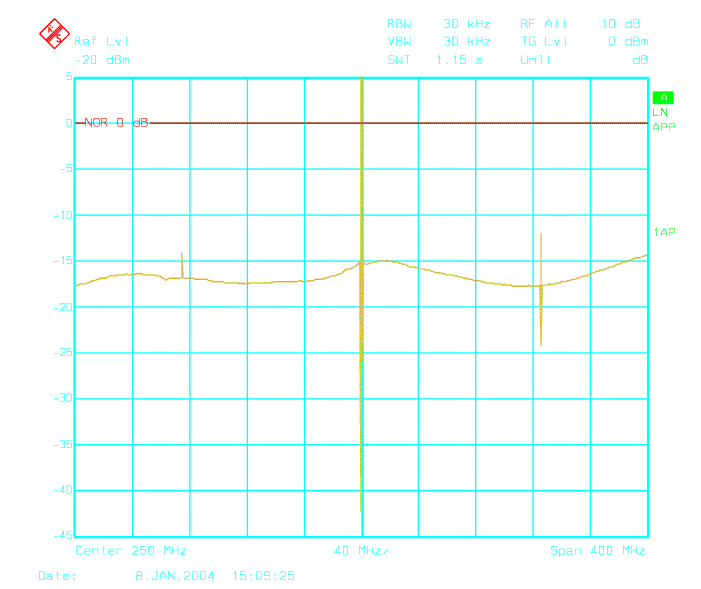
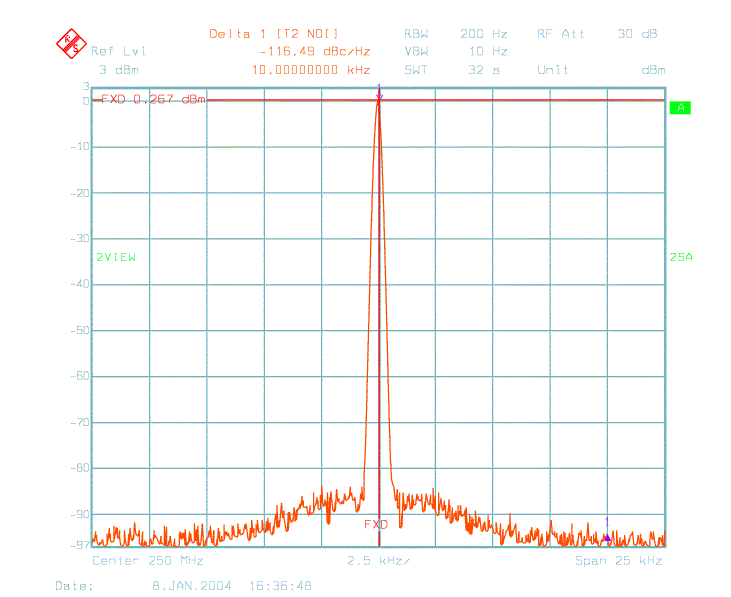
Return loss of the fixed 250 MHz output, measured with the output being active, which explains the spikes.
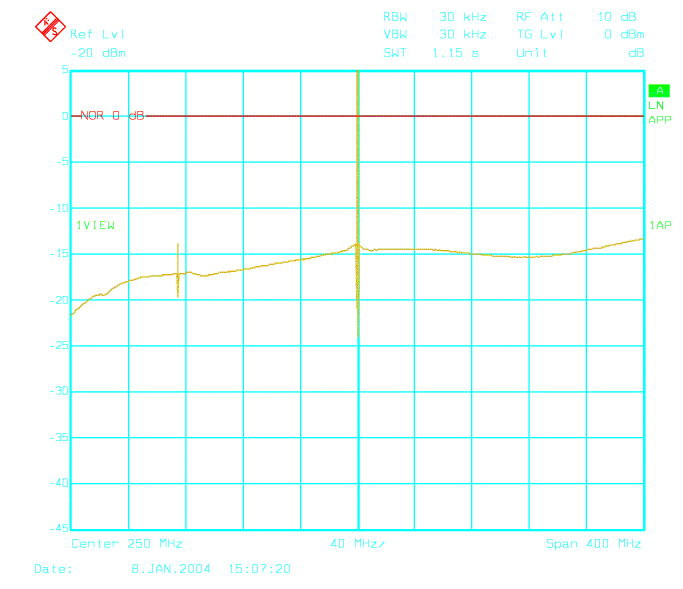
Same for the variable 250 MHz output
3/ Dynamic characteristics
The fractional delay value is incremented from 0 to F and then goes back to 0. It is a that time that the main digital delay line will need to be incremented by 250 ps (one sample). The spike occurring on every 16th step shows the 4 Ghz clock phase gently returning backwards to its zero position. This corresponds to an event previously called "clock rewinding" that is unambiguously generated by the PLL in this design. The phase of the 250 MHz demux clock output that drives the PLL can be seen below:
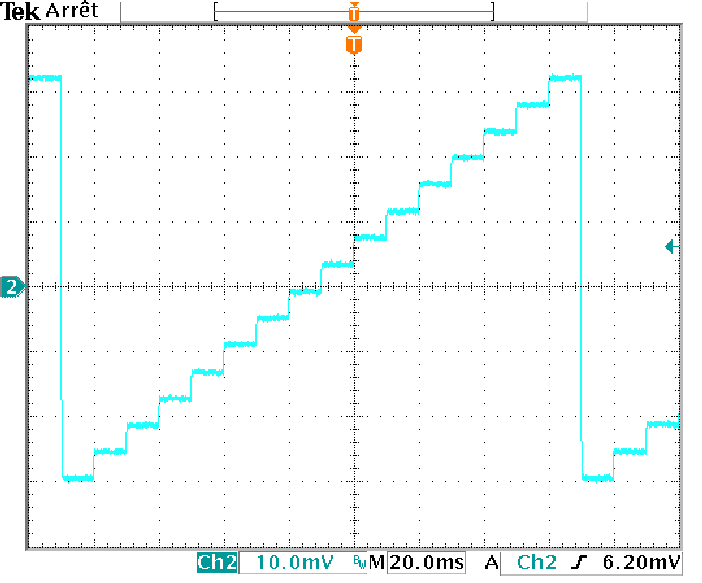
Its peak-to-peak phase deviation is small enough (22.5 degrees) to appear linear.
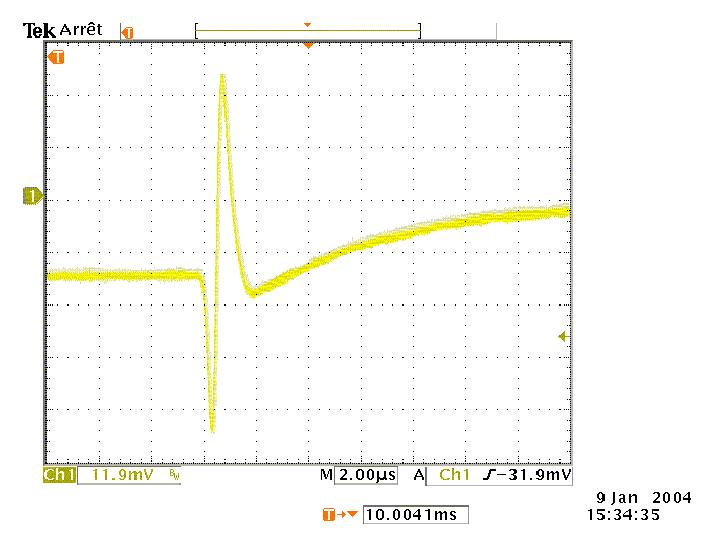
Above : detail of the rewind event. If you can imagine it is a yellow wire wrapped around an invisible cylinder, you'll get a nice representation of angular phase versus time. The phase reaches its final value after some overshoot, which is due to the PLL's transient response.
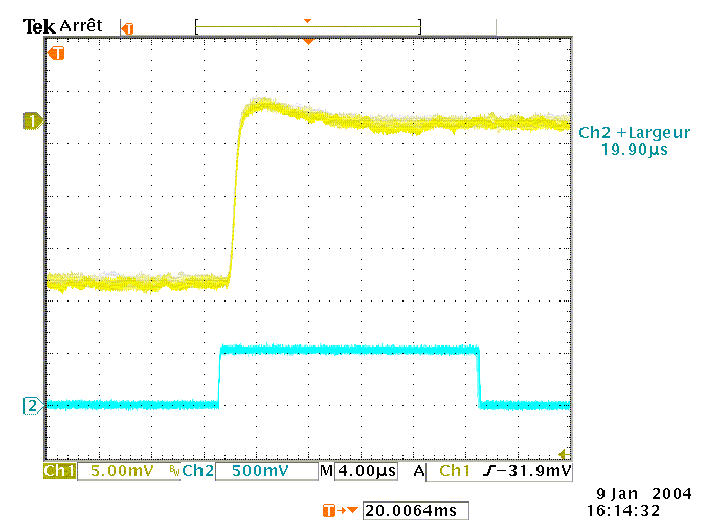
Above : transient response of the PLL for an ordinary step. Blue trace is the 48ms timing signal.
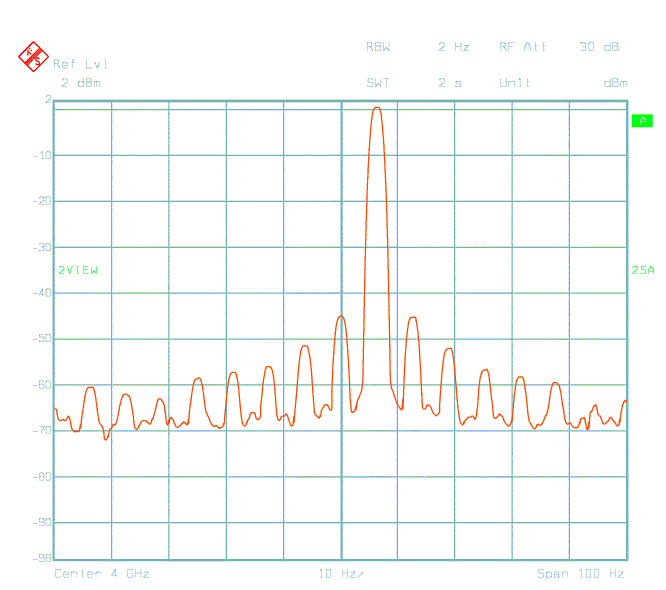
By the way, measuring this signal with a frequency meter would give an average frequency of 4.000.000.000 Hz, although the carrier is at 4.000.000.007 Hz. This is unusual and funny in some respect.
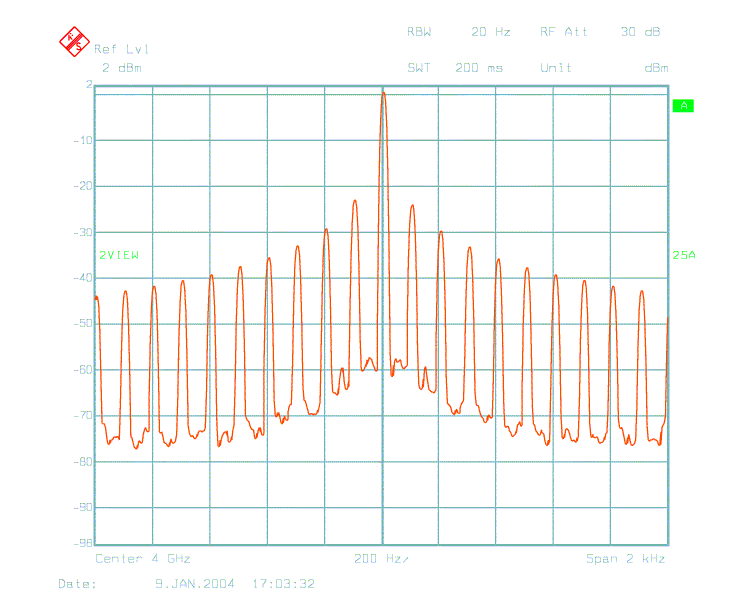
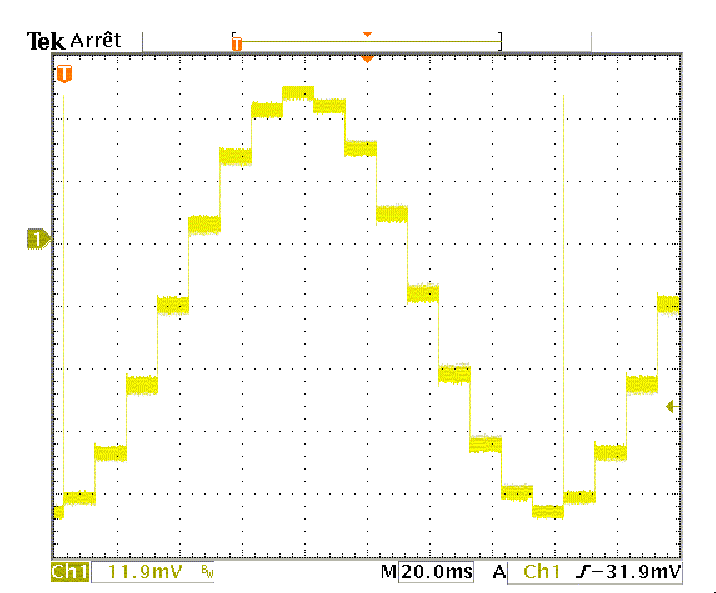
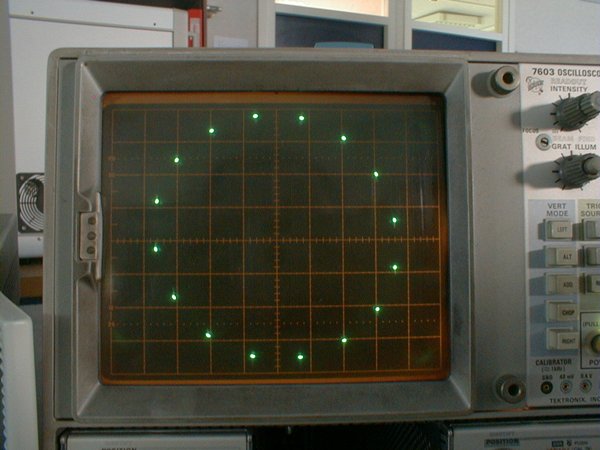
Above : side lines at 100 Hz, caused by the 10ms stepping. This is an almost theoretical 16-PSK spectrum, with negligible rise and fall times. The equivalent constellation, measured with an analog I/Q mixer, can be seen below :
3.3 Phase accuracy
A vector voltmeter can be used to measure the invidual phase of each step, but it is likely that the accuracy of the instrument will set the limit. For assessing the phase accuracy of the DGCK, it is better to remember that any deviation caused by non-linearity is converted into sidebands, at the frequency of which the full 2xPI range is swept (see annex1).
First-order (2 first sidebands only) approximation gives:
pkdev= 2xATAN( sideband/carrier)
Here we have 46 dB (200), and a bit of rough mathematics leads us to a peak deviation of 0.28 deg.