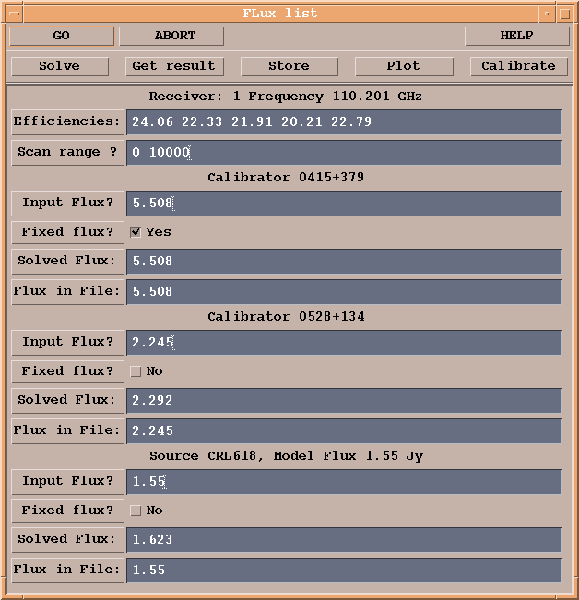
Fig.10.3 is a printout of the ``standard calibration procedure'' used in CLICThis procedure uses the CLIC command SOLVE FLUX which works on cross-correlation only as follows:
In the automatic procedure, the reference sources are the calibrators where Fixed flux is set to YES and the reference values are in the variable Input Flux. Flux in file corresponds to the value stored with the data (by using the observational command FLUX, see lecture 6 by R.Neri for details). The calculation is performed by clicking on SOLVE and the results are displayed inside the variable Solved Flux.
If you want to iterate using one of these values as reference, you need to write it
in the variable Input Flux and set Fixed flux to YES. Like in the
CLIC command SOLVE FLUX, the individual antenna efficiencies (
![]() ) are
computed; these values are only averaged values on the time interval using all
sources. They are then affected by many small biases like pointing or focus errors
and atmospheric decorrelation. They are then usually worse than the canonical values
given in table above (for biases, see end of this section).
) are
computed; these values are only averaged values on the time interval using all
sources. They are then affected by many small biases like pointing or focus errors
and atmospheric decorrelation. They are then usually worse than the canonical values
given in table above (for biases, see end of this section).
When you are satisfied by the flux calibration, you need to click on the following
sequence of buttons: 1) Get Results in order to update the internal variables
of the CLIC procedure, 2) Store to save the flux values inside the header
file (hpb file) and 3) Plot to display the result of your
calibration. The plot shows the inverse of the antenna efficiencies (
![]() )
versus time for all selected sources. If the flux calibration is correct, all
sources must have the same value e.g.
)
versus time for all selected sources. If the flux calibration is correct, all
sources must have the same value e.g.
![]() . This plot is systematically
done in mode amplitude scaled (written on the top left corner). In this mode,
the antenna temperature of each source
TA*(source) in K is divided by its
assumed (variable Input flux) flux density F(source) in Jy (the value you
have just stored), the result is then
. This plot is systematically
done in mode amplitude scaled (written on the top left corner). In this mode,
the antenna temperature of each source
TA*(source) in K is divided by its
assumed (variable Input flux) flux density F(source) in Jy (the value you
have just stored), the result is then
![]() which must be the same for all sources and equal to
which must be the same for all sources and equal to
![]() . If it is not the
case, for example if one source appears systematically lower or higher than the
others, this means that its flux is wrong and you need to iterate.
. If it is not the
case, for example if one source appears systematically lower or higher than the
others, this means that its flux is wrong and you need to iterate.
Note that the scan range, applied on all calibrators, which is by default the scan range of the ``standard calibration procedure'' can be changed. This option is useful when there is some shadowing on one calibrator because the shadowing can strongly affect the result of a SOLVE FLUX. If you change the scan range, do not forget to click on UPDATE.
 |