Test report on the adder module for VLBI phased array operation
M.Torres, P.Chavatte, June, 2000
revised 03/2005
A prototype module performing the addition of the signals of 6 antennas has been built. It makes extensive use of digital technology. Measurements on the reconstructed signal are presented. The dilution effect of the 10 kHz beacon signal (which is applied only on one antenna) is discussed.
Basic information on this technique and on the role of the module inside the system can be found on: http://www.iram.fr/IRAMFR/TA/backend/cor6A/#VLBI
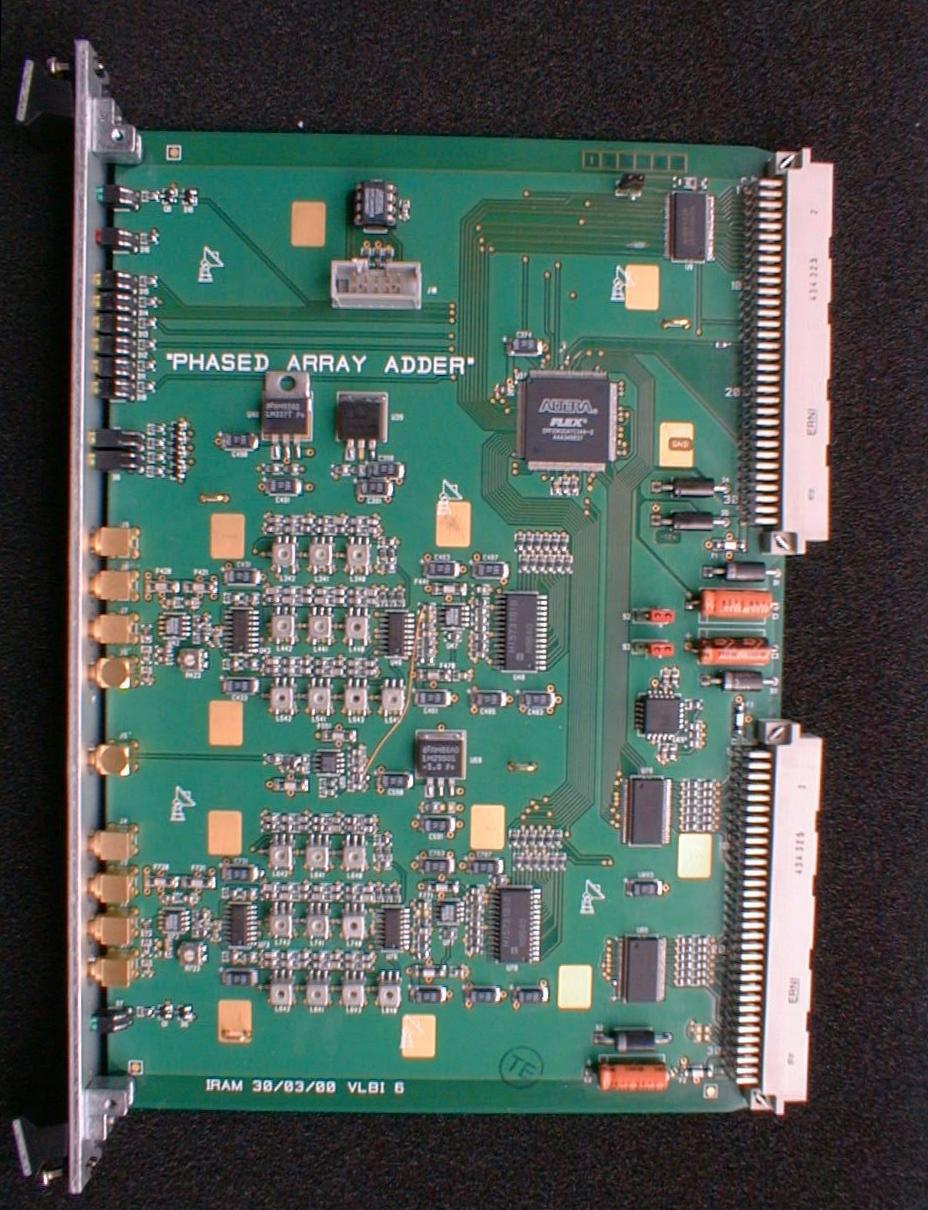
A photograph of the prototype board can be seen on : http://www.iram.fr/IRAMFR/TA/backend/gallery/Adder.jpg
1/ Principle
Each antenna delivers a 2-bit coded sample every 12.5 nanoseconds. Those samples are assigned the arithmetical values 0,1,2,3 which (coarsely) represent the analog voltage that has been sampled. Samples from all the antennas are added together, forming a number ranging from 0 to 18, depending on how many antennas are part of the game.
2/ Block diagram
3/ Results
1/ Bandwidth
The shapes of the reconstructed bands are given below for the values
4,8,and 16 MHz. At 16 MHz, a 3dB rolloff is observed which is explained
partly by the sampling theory, and partly by hardware limitations in
the
D-toA block. Attenuators are automatically inserted in order to
keep total
power constant when changing filters.
2/ Dynamic range issues
The amplitude of the adder output depends on how many antennas are
active,
and also on the correlation of their signals.
Relative level variation for fully
correlated inputs:
| Active antenna number | 1 | 2 | 3 | 4 | 5 | 6 |
| Level (dB-measured) | 0 | 5.96 | 9.51 | 12.0 | 13.9 | 15.5 |
| Level (dB-predicted) | 0 | 6.02 | 9.54 | 12.0 | 14.0 | 15.6 |
| Active antenna number | 1 | 2 | 3 | 4 | 5 | 6 |
| Level (dB-measured) | 0 | 2.97 | 4.75 | 6.03 | 7.00 | 7.81 |
| Level (dB-predicted) | 0 | 3.01 | 4.77 | 6.02 | 6.98 | 7.78 |
3/ Beacon 10 kHz signal
The 1 MHz comb "phasecal" (see it
here)
signal is faintly coupled to the reference antenna. Its n-th line beats
with the LO3 and the LO4 to deliver a XX.010 MHz sinewave at the
USB port of the relevant baseband converter. The following measurement
on this port shows that very little phase noise is intoduced in the
process.
The view is taken arbitrarily on the 7.010 MHz line. In normal
operation
white noise from the receiver would set a floor at -75 dB. For this
shot
the noise source was shut off to enable visibility below this level.
10 kHz beacon spectral quality
When the noise source is switched on again, all elements of the analog channels are driven at their nominal power level. The application of the comb power on the reference channel is an increase of its operating power level. The shape of the comb signal is an extremely narrow pulse of high amplitude. This type of signal is far from the gaussian noise that the analog circuits are designed to handle. Second order distorsion takes place as shown:
IM2 in the analog chain seen on the BBC output
This distorsion (one line gives a family of lines, spaced by 10 kHz) is probably generated in the SSB mixers, where the subtle mechanism of unwanted sideband cancellation may be altered by the strong pulse of the comb. Anyway the level of the unwanted products is very low and will not impair the primary function of the comb which is to align the phases of the various BBC's.
It is interesting to see how faithfully this distorsion pattern (which has been now awarded the grade of signal ! ) is reconstructed after a couple of A-to-D and D-to-A conversions, as shows this shot taken on the output to formatter:
IM2 in the analog chain, seen on the analog sum output to formatter
The module includes a 10 kHz bandpass filter (~ 2 kHz wide) which
can
be used for extracting the pcal tone from the wideband noise of the
reconstructed
output and locally monitor its quality with an oscilloscope. The noise
seen here is mainly amplitude noise.
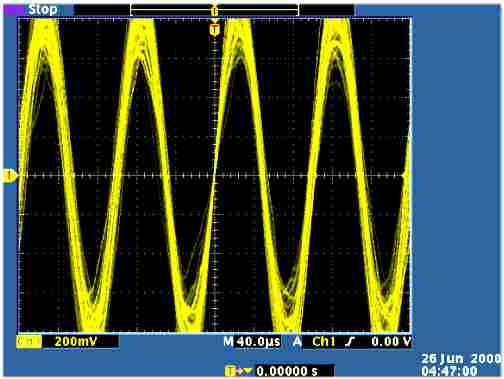
10 kHz tone signal at monitor test point, ref antenna only.
The picture above is taken with the five other (non reference) antennas killed. Now if we add all six antennas, the total power being kept constant, the 10 kHz tone is diluted, and its S/N falls by 8 dB. This is confirmed by the measurement below:
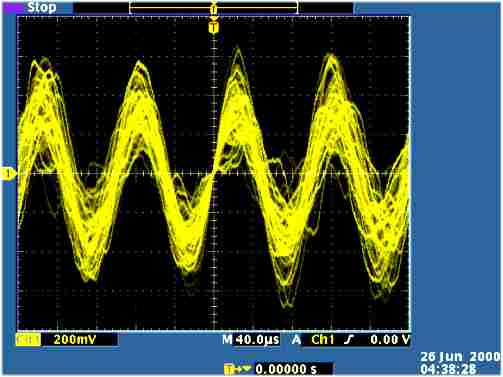
10 kHz tone with all antennas added
A spectrum analyser connected at the analog sum output displays
exactly
what the formatter will see:
Dilution of the 10 kHz signal delivered to the formatter:
Black trace: one antenna active
Green trace: all 6 antennas active
This display materializes the dilution effect, which is 10 log6 =
7.8
dB
One can note the lowfrequency rolloff, which is the overall response
of the analog chain, which was designed at 5 kHz in order to preserve
transmission
of this line.