We now turn to the more difficult problem of correcting for the
time dependence of the complex gains, contained in the functions
![]() .
Variations occur in both amplitude and phase. Let us summarize the
various effects to be calibrated:
.
Variations occur in both amplitude and phase. Let us summarize the
various effects to be calibrated:
 |
(9.21) |
A detailed analysis can be found in [Lay 1997].
This is the standard, traditional way to calibrate the phases with
current interferometers. A point source calibrator is typically
observed for
![]() (a few minutes) every
(a few minutes) every
![]() (20-30 minutes).
One fits a gain curve to the data observed on the calibrator, this
gain curve is an estimate of the actual gain curve
(20-30 minutes).
One fits a gain curve to the data observed on the calibrator, this
gain curve is an estimate of the actual gain curve
![]() . This
enables removing most long-term phase drifts from the observation of
the target source.
. This
enables removing most long-term phase drifts from the observation of
the target source.
 |
(9.22) |
One may reduce
![]() as much as possible to remove a larger part of
the atmospheric fluctuation spectrum. Time scales of the order of
10s may be used, at the expense of:
as much as possible to remove a larger part of
the atmospheric fluctuation spectrum. Time scales of the order of
10s may be used, at the expense of:
A radiometry system may be used to monitor the emission of water vapor at a suitable frequency in front of all antennas (dedicated instrument or astronomy receiver; water line or quasi continuum). The fluctuations in the path length can be of a few % of the total path length due to water vapor.
The fluctuations of the water emission are converted into fluctuations of path length by using an atmospheric model (see lecture by M. Bremer, Chapter 11). In principle one could hope to correct for all phase fluctuations this way. However limitations due to receiver stability, to variations in emission from the ground, and to uncertainty in the determination of the emission to path length conversion factor have the consequence that it is not yet possible to consistently correct for the variation of path length between the source and the calibrator.
So far this method at IRAM/Plateau de Bure is used only to correct for on-source fluctuations. Its main effect is to remove the decorrelation effect due to short-term phase fluctuations, improving the precision of amplitude determination.
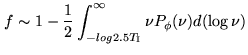
We now consider the simple case where the field contains a strong
point source: it can be a continuum source (quasar) or a line source
(maser). In that case all phase fluctuations with period longer than
![]() are removed, where
are removed, where
![]() is the integration
time. However statistical errors may be mistaken for true
atmospheric phase fluctuations, causing additional decorrelation.
is the integration
time. However statistical errors may be mistaken for true
atmospheric phase fluctuations, causing additional decorrelation.
This method gives good results, but for very specific projects which can be observed in very poor atmospheric conditions (e.g. observation of radio emitting quasars, of stars with strong maser lines).
It is generally easier to measure the path lengths fluctuations at a
lower frequency (even though the phase scales like frequency),
due to both better receiver sensitivity and larger flux of the
referencing source. Moreover, in marginal weather conditions, if the
rms phase fluctuations at 100 GHz is
![]() , then at 230 GHz
they are of
, then at 230 GHz
they are of
![]() , and the phase becomes impossible to
track directly due to
, and the phase becomes impossible to
track directly due to ![]() ambiguities.
ambiguities.
If two receivers are available simultaneously, one may subtract to the high frequency phase the phase measured at the low frequency. The atmospheric fluctuations are cancelled and only a slow instrumental drift remains. The gain curve at the high frequency is then determined as the sum of two terms: the low frequency gain curve (including the slow atmospheric terms) plus that slow instrumental drift (which represents any phase fluctuation affecting one of the signal paths of the two receivers).
This method is currently used at Plateau de Bure.