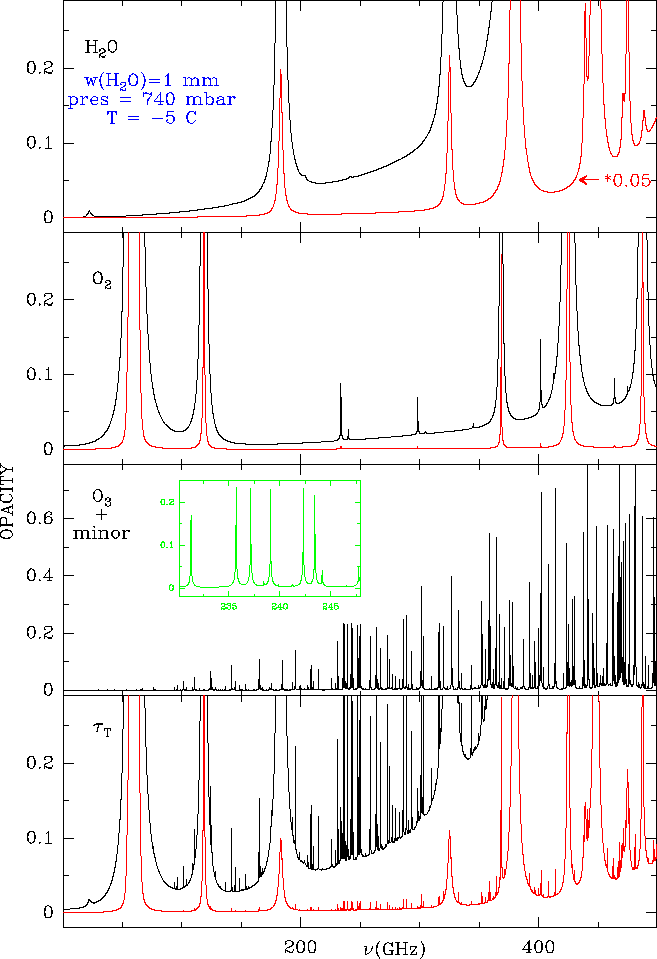
Calculations of zenith atmosphere opacity at 2.5 and 2.9 km, the altitude of the IRAM sites, have been made by [Cernicharo 1988] and [Cernicharo & Pardo 1999]. A computer programme, ATM, repeating these calculations has been installed on-line on the IRAM telescopes of Pico Veleta and Plateau de Bure; it is activated at each calibration or skydip and allows to interpret the observed sky emissivity in terms of water and oxygen contributions and of upper and lower sideband opacities. (During skydips, the antenna is pointed successively at different elevations and the emission of the sky measured at each step; the sky emission variation is fitted by an exponential function of the air mass, and the atmosphere opacity and average temperature readily derived). Note that the opacities derived from sky emissivity observations do not always agree with those calculated from the measurement of p, T, and RH on the site, as water vapor is not at hydrostatic equilibrium.
Some of the results for the band 20-500 GHz are shown on Fig.8.4. One
recognizes from left to right, the (blended) forest of fine structure
transitions from O2, near 60 GHz, the
![]() fine structure
line of O2 at 118.75 GHz, the third lowest lines of para water (still
200 K above the ground level), at 183.31 GHz, and the fourth ortho water
line (420 K above ortho ground level), at 325.15 GHz. The fundamental line
of ortho water
fine structure
line of O2 at 118.75 GHz, the third lowest lines of para water (still
200 K above the ground level), at 183.31 GHz, and the fourth ortho water
line (420 K above ortho ground level), at 325.15 GHz. The fundamental line
of ortho water
![]() , at 556.94 GHz is visible.
The water and oxygen lines delineate the 4 atmospheric ``windows'' of the
millimetre spectrum (called the 3 mm, 2 mm, 1.3 mm and 0.8 mm windows).
Water is seen to dominate completely atmospheric absorption above
150 GHz.
, at 556.94 GHz is visible.
The water and oxygen lines delineate the 4 atmospheric ``windows'' of the
millimetre spectrum (called the 3 mm, 2 mm, 1.3 mm and 0.8 mm windows).
Water is seen to dominate completely atmospheric absorption above
150 GHz.
 |
Less than one millimeter of precipitable water vapor corresponds to exceptionally good winter weather conditions on the sites of Pico Veleta and Plateau de Bure. Such conditions seldom happen even on Mauna Kea. Two to three millimeter of water are standard by clear winter nights at these observatories; six to ten millimeter of water are typical of clear summer nights.
The typical zenith atmosphere opacities, in the dips of the 1.3 mm and 0.8 mm
windows (e.g. at the frequencies of the J=2-1 and 3-2 rotational transitions of
CO, 230.54 and 345.80 GHz ), are respectively 0.15-0.2 and 0.5-0.7 in winter. The
astronomical signals at these frequencies are attenuated by factors of respectively
![]() and 2 at zenith, 1.3 and 2.8 at 45 degree elevation, and 1.7 and 6 at
20 degree elevation. Larger attenuations are the rule in summer and in winter by
less favorable conditions.
and 2 at zenith, 1.3 and 2.8 at 45 degree elevation, and 1.7 and 6 at
20 degree elevation. Larger attenuations are the rule in summer and in winter by
less favorable conditions.
The J=1-0 line of CO, at 115.27 GHz, is close to the 118.75 GHz oxygen line.
Although this latter is relatively narrow, it raises by ![]() 0.3 the atmosphere
opacity (which is 0.35-0.4). The atmosphere attenuation is then intermediate
between those at 230 and 345 GHz (by dry weather, however, it is more stable than
the latter, since the water contribution is small). The measurement of accurate CO
line intensity ratios (even not considering the problems linked to differences in
beam size and receiver sideband gain ratios) requires therefore good weather, a high
source elevation, and a careful monitoring of the atmosphere.
0.3 the atmosphere
opacity (which is 0.35-0.4). The atmosphere attenuation is then intermediate
between those at 230 and 345 GHz (by dry weather, however, it is more stable than
the latter, since the water contribution is small). The measurement of accurate CO
line intensity ratios (even not considering the problems linked to differences in
beam size and receiver sideband gain ratios) requires therefore good weather, a high
source elevation, and a careful monitoring of the atmosphere.
A catalogue of lines intensities in several standard astronomical sources, measured with the IRAM 30 m telescope has been published [Mauersberger et al 1989]. The lines intensities were calibrated by the chopper-wheel method, following the above recipes. The reader is referred to this report for details.