next up previous contents
Next: 2.3 Delay Tracking and Up: 2. Millimetre Interferometers Previous: 2.1 Basic principle   Contents

Subsections

2.2 The Heterodyne Interferometer

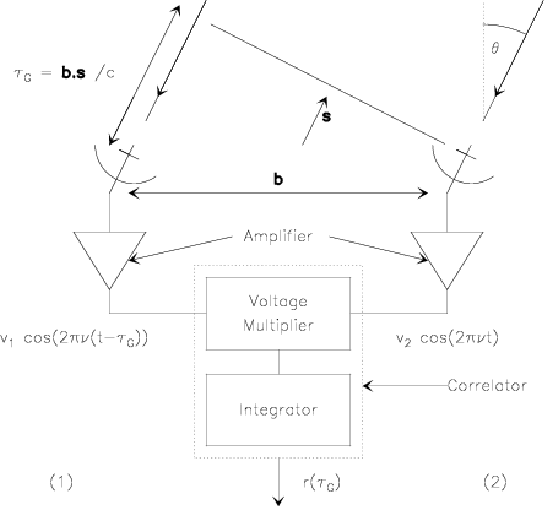
Figure 2.2 is a schematic illustration of a 2-antenna heterodyne interferometer.

Figure 2.2: Schematic Diagram of a two-element interferometer
\resizebox{12.0cm}{!}{\includegraphics{sg1f2br.eps}}

Let us forget the frequency conversion for some time, i.e. assume $ \nu_{IF} = \nu_{RF}$...

The input (amplified) signals from 2 elements of the interferometer are processed by a correlator, which is just a voltage multiplier followed by a time integrator. With one incident plane wave, the output $ r(t)$ is

$\displaystyle r(t) = < v_1 \cos(2\pi\nu(t-\tau_g(t))) v_2 \cos(2\pi\nu t) > = v_1 v_2 \cos(2 \pi\nu \tau_g(t))$ (2.11)

where $ \tau_g$ is obviously the geometrical delay,

$\displaystyle \tau_g(t) = (\ensuremath{\text{\boldmath$b$\unboldmath }}. \ensuremath{\text{\boldmath$s$\unboldmath }})/c$ (2.12)

The derivation assumes that $ v_1, v_2$ and $ \tau_g(t)$ varies slowly compared to the averaging timescale, which should nevertheless be long enough compared to frequency $ \nu $.

As $ \tau_g$ varies slowly because of Earth rotation, $ r(t)$ oscillates as a cosine function, and is thus called the fringe pattern. As we had shown before that $ v_1$ and $ v_2$ were proportional to the electric field of the incident wave, the correlator output (fringe pattern) is thus proportional to the power (intensity) of the wave.

2.2.1 Source Size Effects

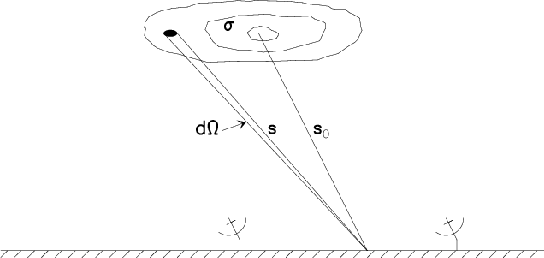
The signal power received from a sky area $ d\Omega $ in direction $s$ is (see Fig.2.3 for notations) $ A({\ensuremath{\text{\boldmath $s$\unboldmath }}}) I({\ensuremath{\text{\boldmath $s$\unboldmath }}})
d\Omega d\nu $ over bandwidth $ d\nu$, where $ A({\ensuremath{\text{\boldmath $s$\unboldmath }}})$ is the antenna power pattern (assumed identical for both elements, more precisely $ A({\ensuremath{\text{\boldmath $s$\unboldmath }}}) = A_i({\ensuremath{\text{\boldmath $s$\unboldmath }}}) A_j({\ensuremath{\text{\boldmath $s$\unboldmath }}})$ with $ A_i$ the voltage pattern of antenna $ i$, and $ I({\ensuremath{\text{\boldmath $s$\unboldmath }}})$ is the sky brightness distribution

$\displaystyle dr$ $\displaystyle =$ $\displaystyle A({\ensuremath{\text{\boldmath$s$\unboldmath }}}) I({\ensuremath{\text{\boldmath$s$\unboldmath }}}) d\Omega d\nu \cos(2 \pi \nu \tau_g)$ (2.13)
$\displaystyle r$ $\displaystyle =$ $\displaystyle d\nu \int_{Sky} A({\ensuremath{\text{\boldmath$s$\unboldmath }}})...
...ldmath$b$\unboldmath }}.\ensuremath{\text{\boldmath$s$\unboldmath }}/c) d\Omega$ (2.14)

Figure: Position vectors used for the expression of the interferometer response to an extended source, schematically represented by the iso-contours of the sky brightness distribution. $ \ensuremath{\text{\boldmath $s$\unboldmath}}_0$ is the tracking center of the interferometer, $ \ensuremath{\text{\boldmath $s$\unboldmath}}$ the source vector, and $ d\Omega $ a solid angle around the source.
\resizebox{12.0cm}{!}{\includegraphics{sg1f3br.eps}}

Two implicit assumptions have been made in deriving Eq.2.14. We assumed incident plane waves, which implies that the source must be in the far field of the interferometer. We used a linear superposition of the incident waves, which implies that the source must be spatially incoherent. These assumptions are quite valid for most astronomical sources, but may be violated under special circumstances. For example VLBI observations of solar system objects would violate the first assumption, while observations of celestial masers could violate the second one (if they were coherent as laboratory lasers, but observations have revealed astronomical masers are in fact incoherent).

When the interferometer is tracking a source in direction $ {\ensuremath{\text{\boldmath $s$\unboldmath }}_o}$, with $ {\ensuremath{\text{\boldmath $s$\unboldmath }}} = {\ensuremath{\text{\boldmath $s$\unboldmath }}_o} + {\ensuremath{\text{\boldmath $\sigma$\unboldmath }}}$

$\displaystyle r$ $\displaystyle =$ $\displaystyle d\nu \cos(2 \pi \nu \ensuremath{\text{\boldmath$b$\unboldmath }}....
...h$b$\unboldmath }}.\ensuremath{\text{\boldmath$\sigma$\unboldmath }}/c) d\Omega$  
  $\displaystyle -$ $\displaystyle d\nu {\rm sin}(2 \pi \nu \ensuremath{\text{\boldmath$b$\unboldmat...
...h$b$\unboldmath }}.\ensuremath{\text{\boldmath$\sigma$\unboldmath }}/c) d\Omega$ (2.15)

We define the Complex Visibility

$\displaystyle V = \vert V\vert e^{i\Phi_V} = \int_{Sky} A(\ensuremath{\text{\bo...
...\unboldmath }}}.{\ensuremath{\text{\boldmath$\sigma$\unboldmath }}}/c)} d\Omega$ (2.16)

which resembles a Fourier Transform...

We thus have

$\displaystyle r$ $\displaystyle =$ $\displaystyle d\nu \left( \cos(2 \pi \nu \ensuremath{\text{\boldmath$b$\unboldm...
...emath{\text{\boldmath$s$\unboldmath }}_o / c)
\vert V\vert \sin(\Phi_V) \right)$  
  $\displaystyle =$ $\displaystyle d\nu \vert V\vert \cos(2\pi \nu \tau_G- \Phi_V)$ (2.17)

i.e. the correlator output is proportional to the amplitude of the visibility, and contains a phase relation with the visibility.

2.2.2 Finite Bandwidth

Integrating over $ d\nu$,

$\displaystyle R = \frac{1}{\Delta \nu} \int_{\nu_0-\Delta \nu / 2}^{\nu_0+\Delta \nu /2} \vert V\vert \cos(2 \pi \nu \tau_G- \Phi_V) d\nu$ (2.18)

Using $ \nu = \nu_0 + n$
$\displaystyle R$ $\displaystyle =$ $\displaystyle \frac{1}{\Delta \nu} \int_{-\Delta \nu /2}^{\Delta \nu / 2}
\vert V\vert \cos(2 \pi \nu_0 \tau_G- \Phi_V + 2 \pi n \tau_g) dn$ (2.19)
  $\displaystyle =$ $\displaystyle \frac{1}{\Delta \nu} [ \int_{-\Delta \nu /2}^{\Delta \nu / 2}
\vert V\vert \cos(2 \pi \nu_0 \tau_G- \Phi_V) \cos(2 \pi n \tau_g) dn$  
    $\displaystyle - \int_{-\Delta \nu /2}^{\Delta \nu / 2}
\vert V\vert \sin(2 \pi \nu_0 \tau_G- \Phi_V) \sin(2 \pi n \tau_g) dn ]$ (2.20)
  $\displaystyle =$ $\displaystyle \frac{1}{\Delta \nu} \vert V\vert \cos( 2 \pi \nu_0 \tau_G- \Phi_...
... \pi n \tau_g) \right]_{-\Delta \nu /2}^{\Delta \nu / 2}
\frac{1}{2 \pi \tau_g}$  
    $\displaystyle + \frac{1}{\Delta \nu} \vert V\vert \sin( 2 \pi \nu_0 \tau_G- \Ph...
... \pi n \tau_g) \right]_{-\Delta \nu /2}^{\Delta \nu / 2}
\frac{1}{2 \pi \tau_g}$ (2.21)
  $\displaystyle =$ $\displaystyle \vert V\vert \cos(2 \pi \nu_0 \tau_G- \Phi_V) \frac{\sin(\pi \Delta \nu \tau_g)}
{\pi \Delta \nu \tau_g}$ (2.22)

The fringe visibility is attenuated by a $ {\rm sin}(x)/x$ envelope, called the bandwidth pattern, which falls off rapidly. A 1% loss in visibility is obtained for $ \vert\Delta\nu\tau_g\vert \simeq
0.078$, or with $ \Delta\nu = 500$MHz and a baseline length $ b =
100$m, when the zenith angle $ \theta$ (defined in Fig.2.3) is 2 arcmin only. Thus, the ability to track a source for a significant hour angle coverage requires proper compensation of the geometrical delay when a finite bandwidth is desired.


next up previous contents
Next: 2.3 Delay Tracking and Up: 2. Millimetre Interferometers Previous: 2.1 Basic principle   Contents
Anne Dutrey