


Next: 13.3 The ``Standard Calibration
Up: 13. Calibration of data
Previous: 13.1 Introduction
Contents
The procedure ``First Look'' provides information about the weather conditions
and a few instrumental parameters at the time of the observations. This information
is very important as it helps you to make a first data quality assessment even
before you may start with the interactive data calibration procedure. The panel of
the procedure is shown on Fig.13.1.
Figure 13.1:
``First Look'' panel
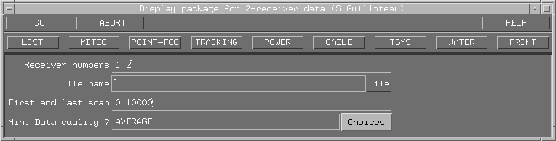 |
Monitoring information is provided on:

- Meteorology: the average and maximum wind
velocity, the ambient pressure and temperature. Gusty conditions and observations
with wind velocities above 10m/s may show up with high pointing corrections. Take
care to tag visibilities which may be affected by such difficult observing
conditions.
- Pointing and Focus: the applied corrections are
shown for all the antennas in the array. Only differential variations in the
corrections play a role, not the absolute amount. Sudden pointing corrections by
more than 10
 can considerably spoil the visibilities, especially at the highest
observing frequencies. A similar consideration applies for antenna focus
corrections, although visibilities are automatically corrected for phase offsets
which are generated by focus corrections.
can considerably spoil the visibilities, especially at the highest
observing frequencies. A similar consideration applies for antenna focus
corrections, although visibilities are automatically corrected for phase offsets
which are generated by focus corrections.
- Tracking Errors: The tracking errors in
azimuth and in elevation are given for all antennas.
- Total Power: a trace of the total incident
atmospheric power recorded by the continuum detectors (one for each receiver, each
one second), helps in further evaluating the data quality. As a rule, strong and
rapid variations in the total power trace the presence of clouds in the line of
sight while a sudden up- or down-stepping on one antenna and on one receiver is a
sign of a renewed receiver tuning. The total power increases in general with the air
mass.
- Cable Phase: variations in the electrical length
of the cables show up in phase variations (referenced to the LO2 phases). These are
measured by a phasemeter. Appropriate corrections for the phases of the LO1 rotators
are computed taking
 times the corrections measured by the phasemeters of the
3mm receivers and
times the corrections measured by the phasemeters of the
3mm receivers and  times the corrections measured by the phasemeters of the
1mm receivers, where is the harmonic number of the tuned frequency. Strong and
rapid variations while a source is tracked may indicate a fault in a cable (these
data should perhaps be flagged), whereas a sudden but steady change is mostly
related to a shift in the antenna pointing.
times the corrections measured by the phasemeters of the
1mm receivers, where is the harmonic number of the tuned frequency. Strong and
rapid variations while a source is tracked may indicate a fault in a cable (these
data should perhaps be flagged), whereas a sudden but steady change is mostly
related to a shift in the antenna pointing.
- System Temperature: dependent on the
observing conditions and on the frequency. As for the total power
detectors, strong and rapid variations in the system temperature trace
atmospheric instability, whereas a sudden but steady change on one
receiver is a sign of a renewed receiver tuning.
- Water vapor: the content of precipitable water
vapor in the atmosphere is a critical parameter on which the quality of most of the
high frequency observations depend. Should the measured water vapor content not be
consistent (or roughly) on all the high frequency receivers, please check the
receiver gain.
Finally, the ``First look'' procedure produces a short list of all the scans
recorded at the time of the execution of a project. Such a listing allows you to
trace back the sequence of operations during an observing run. Note that the range
of scan validity for the calibration procedure sets up with the last GAIN scan
in the short list.
Looking at the results of the procedure (called in the example above
show-28-feb-2001-x007.ps.gz) should be done simultaneously with the reading
of the project.note file (here x007.note).
Next: 13.3 The ``Standard Calibration
Up: 13. Calibration of data
Previous: 13.1 Introduction
Contents
Anne Dutrey