One may simply wish to average several channels to increase the signal to noise ratio (use tasks UV_COMPRESS and UV_AVERAGE).
For sources with circular symmetry it may be necessary to obtain the
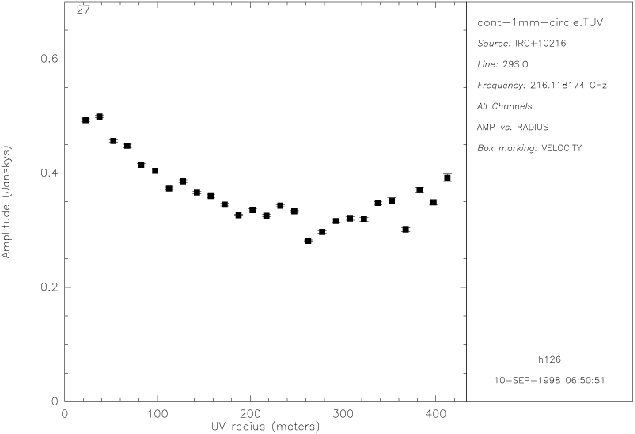
variation of amplitude with antenna spacing, in order to compare the
amplitude data with models. For this purpose, with task UV_CIRCLE one takes the mean of all the visibilities in
concentric rings in the ![]() plane. The output has the format of a
plane. The output has the format of a
![]() table (except that all
table (except that all ![]() 's are zero), and may be plotted with
UVALL (fig. 14.5).
's are zero), and may be plotted with
UVALL (fig. 14.5).
Use this sort of averaging with caution: the phase center must
accurately coincide with the source position or the amplitude of the
visibility average will decrease on long spacings (use UV_FIT
and UV_SHIFT).
One may also do this kind of averaging in separate sectors in the ![]() plane, to check for asymmetries, provided the
plane, to check for asymmetries, provided the ![]() plane is well
sampled (task UV_CUTS).
plane is well
sampled (task UV_CUTS).