The instrument used for this work has
been described in Serabyn & Weisstein [1995]. Recently,
new 1.1 THz and 1.6 THz
low-pass filters have been installed in front of the ![]() He
cooled bolometer detector in order to efficiently cover both the
full subTHz domain and the supraterahertz windows that are
predicted by theory. The first successful measurements on Mauna
Kea using the 1.1 THz filter were obtained on the night of 1998
April 1
He
cooled bolometer detector in order to efficiently cover both the
full subTHz domain and the supraterahertz windows that are
predicted by theory. The first successful measurements on Mauna
Kea using the 1.1 THz filter were obtained on the night of 1998
April 1![]() under extremely dry ``El Niño'' conditions. It
was estimated that the H
under extremely dry ``El Niño'' conditions. It
was estimated that the H![]() O column was under 0.2 mm, so it is
clear that these data offered the best opportunity for a
determination of the dry and wet longwave nonresonant terms
[
O column was under 0.2 mm, so it is
clear that these data offered the best opportunity for a
determination of the dry and wet longwave nonresonant terms
[![]()
![]() ,
, ![]()
![]() ]. However, to separate one from the
other, an independent measurement under the same P/T conditions
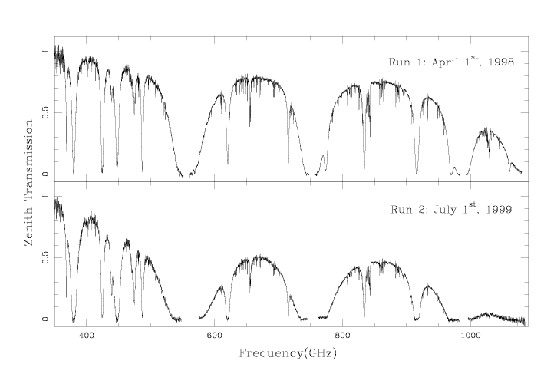
was needed. This occurred in a second run in July 1999, greatly
simplifying our analysis (see Figure 10.2). From these 2
datasets, our goals have been to:
]. However, to separate one from the
other, an independent measurement under the same P/T conditions
was needed. This occurred in a second run in July 1999, greatly
simplifying our analysis (see Figure 10.2). From these 2
datasets, our goals have been to:
I) Extract the dry continuum from our measurements and determine its origin.
II) Determine the H![]() O excess absorption in the
submillimeter domain in low humidity conditions (when only
foreign-gas collisions have to be taken into account), and
compare it to proposed formulations.
O excess absorption in the
submillimeter domain in low humidity conditions (when only
foreign-gas collisions have to be taken into account), and
compare it to proposed formulations.
The separation of these two terms using the data from the upper panel of Figure 10.2 is described in detail in Pardo et al [2001a] and leads to the formulation given in section 10.2.5. This is the first time that such a separation is done successfully in the submillimeter.
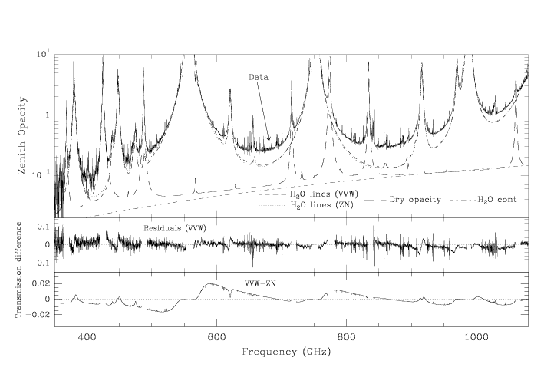
Our results indicate that the H![]() O and dry continuum-like
terms of existing models are not accurate in the submillimeter
range and that the models should be updated accordingly. This has
been done in Pardo et al [2001b]. The lower panel of Figure
10.5 shows the April 98 data and the separate opacity
contributions that add up to fit the observed opacity.
O and dry continuum-like
terms of existing models are not accurate in the submillimeter
range and that the models should be updated accordingly. This has
been done in Pardo et al [2001b]. The lower panel of Figure
10.5 shows the April 98 data and the separate opacity
contributions that add up to fit the observed opacity.
|
The first of such experiments has been operated by Nobeyama
Observatory at Pampa la Bola, 4800 m above sea level in
northern Chile on September 1997 and June 1998. The
instrument is a Martin-Puplett
type FTS with an InSb bolometer as detector. The
frequency range covered is 150 - 1600 GHz
(or 2 mm to slightly under 200 ![]() m wavelength). Further details on
the instrument can be found in Matsushita et al [1999].
m wavelength). Further details on
the instrument can be found in Matsushita et al [1999].
On the morning of 1998 June 17, the best atmospheric
transmission spectrum of the experiment was recorded.
(Fig. 10.3, top). However, due to the
limited sensitivity around 1500 GHz and offset errors in
the phase correction of the Fourier-transformed spectra, there are some
systematic errors in the transmission spectra
around the 1450 - 1600 GHz window
(it could be up to 10% in transmission). During
the observing run, side-by-side measurements
with the second FTS experiment in the area (at Chajnantor
[Paine et al 2000])
were performed. The measured transmission spectra
showed very good correspondence to
each other within an accuracy of ![]() % in
the 650 GHz and 850 GHz windows.
% in
the 650 GHz and 850 GHz windows.
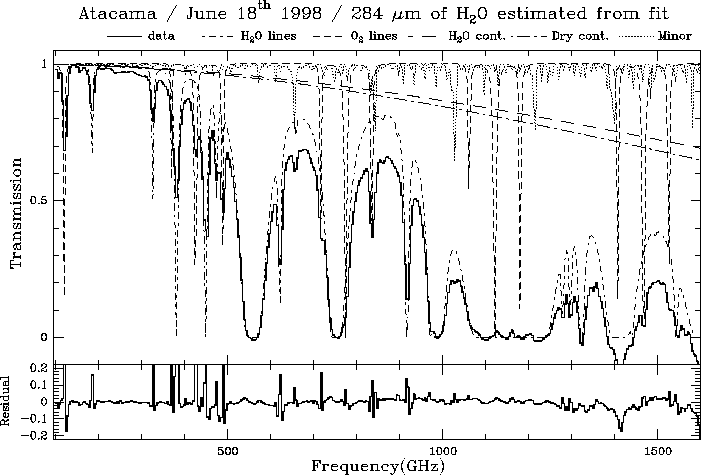
Again, radiative-transfer calculations using the model ATM were
performed to fit the data. The best fit of the June 17![]() spectrum
is shown in Fig. 10.3. The model, that took advantage
of what we learned from the Mauna Kea data, fits very well the observed
spectrum with only one free parameter (the precipitable water vapor column
[
spectrum
is shown in Fig. 10.3. The model, that took advantage
of what we learned from the Mauna Kea data, fits very well the observed
spectrum with only one free parameter (the precipitable water vapor column
[
![]() ] above the site) except for frequencies higher than 1350 GHz, where
the measurement suffers from systematic errors. The fit results
in a water vapor column of 0.284 mm.
] above the site) except for frequencies higher than 1350 GHz, where
the measurement suffers from systematic errors. The fit results
in a water vapor column of 0.284 mm.
 |